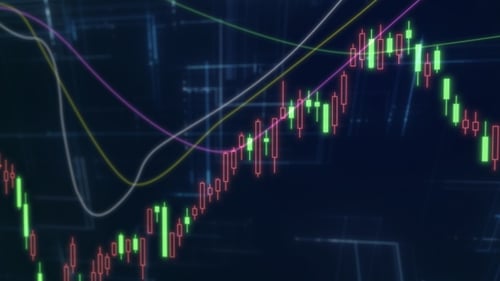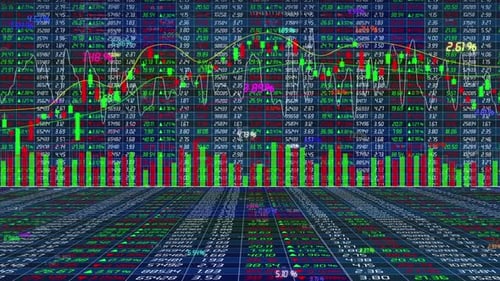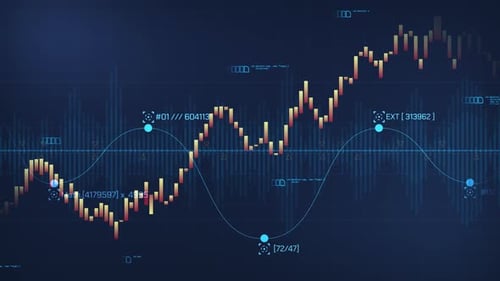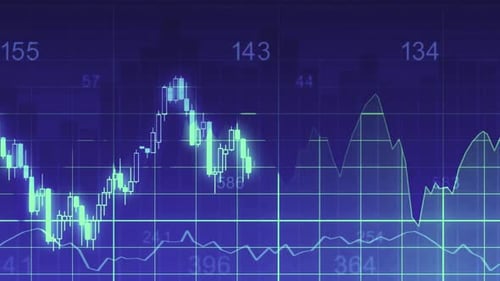
Futuristic Candlestick Chart Animation for Financial Market Data
By AslinShenOne great value subscription from €14.50/month
- Unlimited downloads of 27+ million creative assets
- AI Tools: video, image and more
- Lifetime commercial license
- Easy cancellation
Already have an account? Sign in
Attributes
- Length
- 0:10
- Resolution
- 3840 x 2160
- File Size
- 363 MB
- Frame Rate
- 25 fps
- Alpha Channel
- No
- Looped
- No
- Video Encoding
- ProRes
- Orientation
- Horizontal
- Commercial License
- Further Information
Description
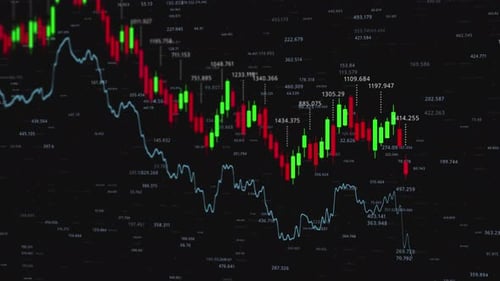
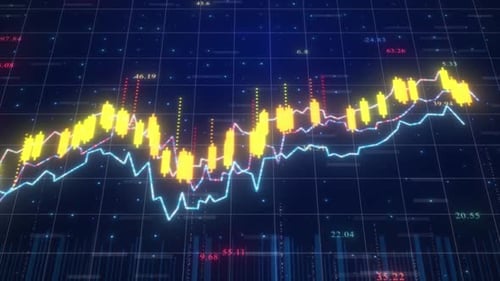
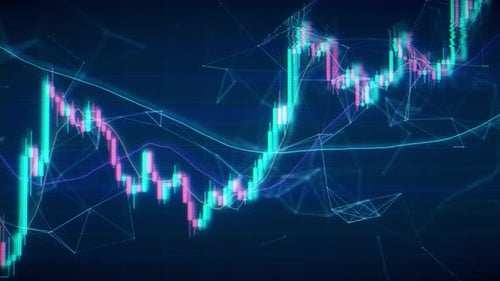
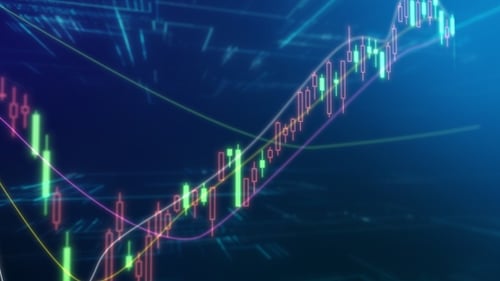
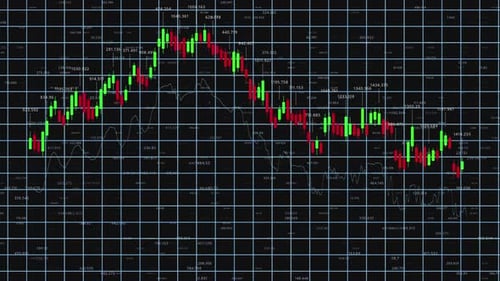
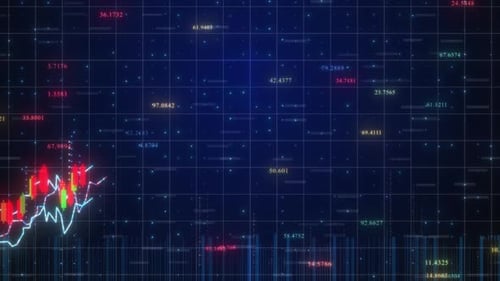
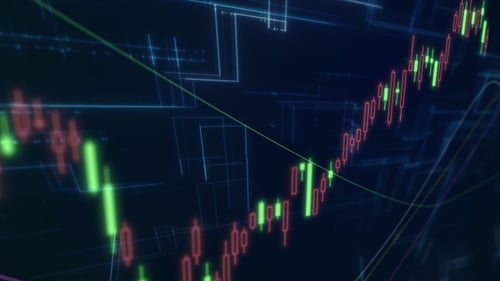
This animated visual effect presents a dynamic candlestick chart, illustrating complex financial market data with a futuristic aesthetic. Glowing green and red candlesticks fluctuate, depicting rising and falling trends against a sophisticated digital grid background. Complementary flowing lines animate across the screen, adding depth and a sense of constant data flow. Designed for corporate presentations, business reports, and economic analysis, this motion graphic elevates any project requiring a professional, tech-savvy representation of stock market movements or financial indicators. It provides a sleek and engaging backdrop for discussions on global economics, investment strategies, and technological advancements in finance.