Modern Corporate Data Presentation with Animated Charts
By lado-benOne great value subscription from €14.50/month
- Unlimited downloads of 27+ million creative assets
- AI Tools: video, image and more
- Lifetime commercial license
- Easy cancellation
Already have an account? Sign in
Attributes
- Length
- 0:11
- Resolution
- 3840 x 2160
- File Size
- 693 MB
- Frame Rate
- 30 fps
- Alpha Channel
- No
- Looped
- No
- Video Encoding
- ProRes
- Orientation
- Horizontal
- Commercial License
- Further Information
Description
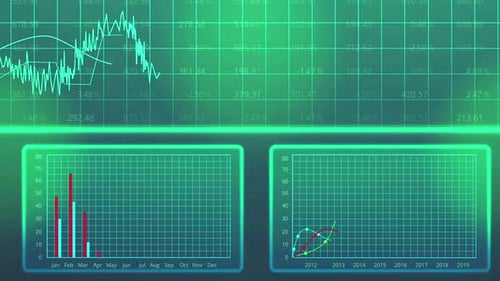
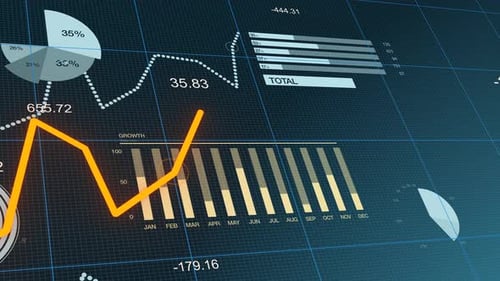
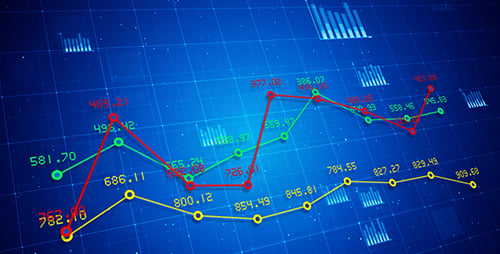
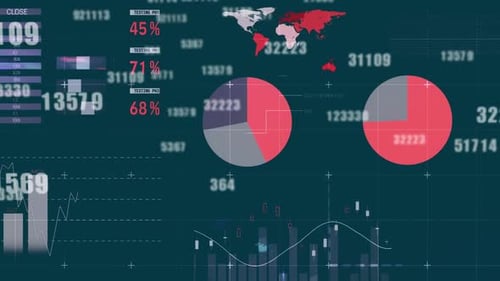
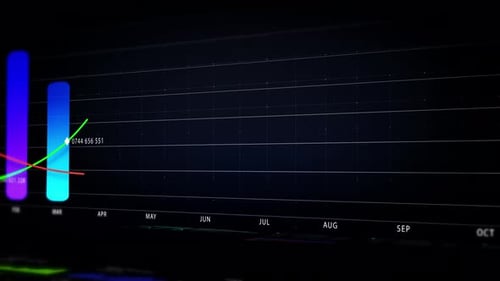
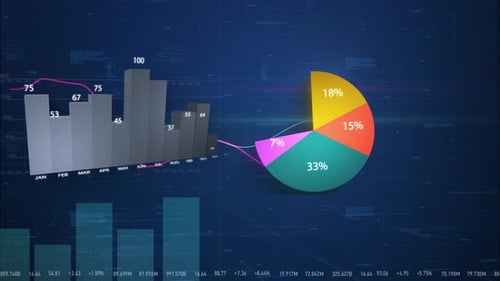
This animated visual effect presents dynamic business data through a series of expanding bar charts and updating numerical indicators. The sleek, modern design features a blue-hued digital interface with clean lines and subtle background elements, creating a sophisticated display. As the central bar graph progresses, showing month-by-month data, accompanying percentages and figures in circular and rectangular overlays provide additional statistics. This clear and precise data visualization is ideal for corporate presentations, financial reports, technology explainers, and any project requiring a professional and engaging way to represent complex information with clarity and style. It adds an analytical edge and polished look to any business-oriented content.