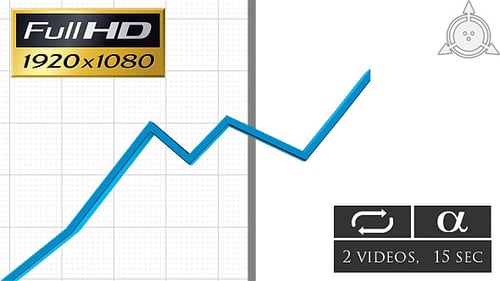
Dynamic 3D Line Graph Data Presentation
By meshgridOne great value subscription from €14.50/month
- Unlimited downloads of 27+ million creative assets
- AI Tools: video, image and more
- Lifetime commercial license
- Easy cancellation
Already have an account? Sign in
Attributes
- Length
- 0:06
- Resolution
- 1920 x 1080
- File Size
- 4.64 MB
- Frame Rate
- 29.97 fps
- Alpha Channel
- No
- Looped
- No
- Video Encoding
- H.264
- Orientation
- Horizontal
- Commercial License
- Further Information
Description
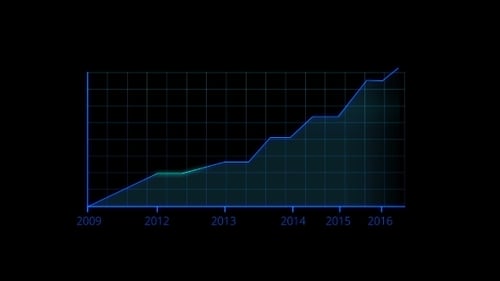
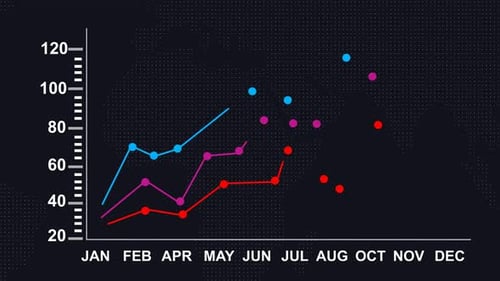
This dynamic 3D animated line graph visually represents evolving data over time. The clean design features a visible x and y axis grid, where colored data points progressively appear, culminating in fluidly drawn lines that connect these points to illustrate trends and growth. Ideal for enhancing corporate presentations, financial reports, business analytics videos, or educational content, this visual asset effectively communicates complex statistical information with a polished and professional aesthetic. The animation provides a clear and engaging way to visualize data progression and comparisons.