Animated Financial Bar Chart with Global Money Background
By AdepthandOne great value subscription from €14.50/month
- Unlimited downloads of 27+ million creative assets
- AI Tools: video, image and more
- Lifetime commercial license
- Easy cancellation
Already have an account? Sign in
Attributes
- Length
- 0:08
- Resolution
- 3840 x 2160
- File Size
- 10.6 MB
- Frame Rate
- 29.97 fps
- Alpha Channel
- No
- Looped
- No
- Video Encoding
- H.264
- Orientation
- Horizontal
- Commercial License
- Further Information
Description
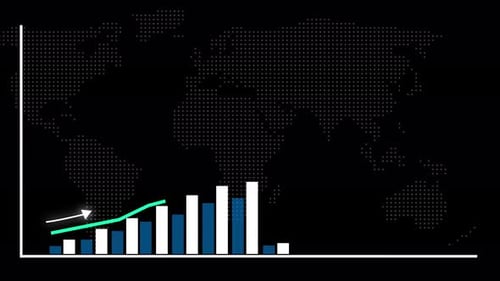
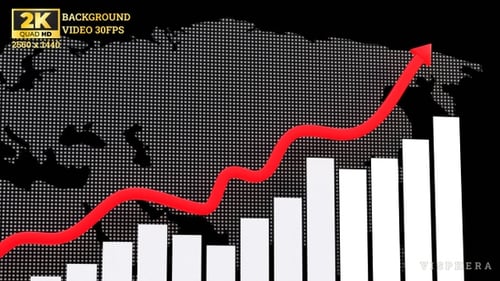
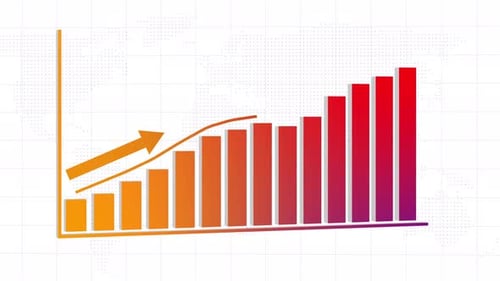
A dynamic animated bar chart emerges and illustrates growth or increasing values over time. Red bars sequentially rise from left to right, culminating in a sweeping red arrow that reinforces the positive trend. The entire visualization is set against a subtle, repeating background of faded hundred-dollar bills overlaid with a transparent world map. This animation is an excellent choice for business presentations, financial reports, economic analyses, or any project requiring a clear and professional visualization of data. It effectively communicates an upward trajectory and economic success, making complex information easily digestible and engaging for the audience.