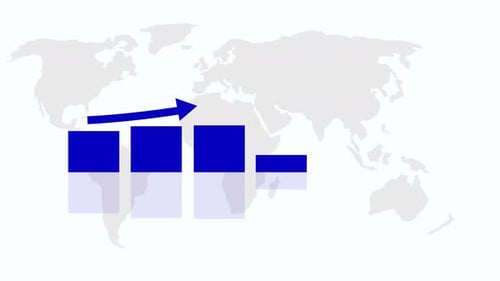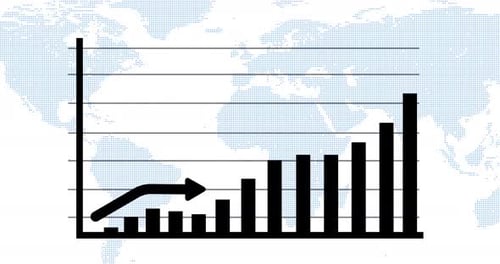
Animated Bar Graph and Line Chart with Global Map Background
By stockexOne great value subscription from €14.50/month
- Unlimited downloads of 27+ million creative assets
- AI Tools: video, image and more
- Lifetime commercial license
- Easy cancellation
Already have an account? Sign in
Attributes
- Length
- 0:08
- Resolution
- 3840 x 2160
- File Size
- 5.66 MB
- Frame Rate
- 29.97 fps
- Alpha Channel
- No
- Looped
- No
- Video Encoding
- H.264
- Orientation
- Horizontal
- Commercial License
- Further Information
Description
This animated visual presents a dynamic bar graph with a corresponding ascending line chart, set against a stylized, grid-patterned world map background. The orange and blue bars grow progressively from left to right, indicating increasing values, while a blue line simultaneously charts an upward trajectory, signifying growth and positive trends. The clean design and clear data visualization make this animation ideal for illustrating business reports, financial analysis, global market trends, or scientific data presentations. It enhances corporate videos, news broadcasts, and educational content by providing a professional and engaging way to represent statistical information and progress.